

Thanh bên bài viết

 CC BY 4.0
Truy cập mở
CC BY 4.0
Truy cập mở
Được sao chép, phân phối lại và chỉnh sửa bài báo, với điều kiện:
-
Ghi nguồn tác giả và bài báo gốc
© 2026 Tạp chí Khoa học và Công nghệ Nhiệt đới
Potential Distribution Modeling of Dipterocarpus obtusifolius in Gia Lai Province, Vietnam: An Application of Maxent for Dry Dipterocarp Forest Conservation
Nội dung chính của bài viết
Tóm tắt
Dry dipterocarp forests are seasonally deciduous systems of high ecological value across mainland Southeast Asia, yet they have declined markedly in Gia Lai Province due to logging and land-use conversion. Dipterocarpus obtusifolius is a dominant, fire-tolerant species in this biome and a priority for restoration. We developed presence-only species distribution models (MaxEnt) to map the species’ potential habitat and support spatial prioritization for reforestation. Using 119 occurrence records and 19 WorldClim bioclimatic variables, we first fitted a full model to assess relative variable importance, then refitted a reduced model with seven top predictors. Both models performed excellently: test AUC was 0.9294 (19-variable model) and 0.9311 (7-variable model), with mean TSS ≈ 0.83 for both. The most influential predictors were the mean temperature of the wettest quarter (BIO08; 28.7% contribution) and the maximum temperature of the warmest month (BIO05; 22.1%), while precipitation of the driest month (BIO14) showed the highest permutation importance (66.7%), underscoring the species’ sensitivity to dry-season hydroclimate. Under the “equate entropy” threshold, suitable habitat occupied 18.47% of Gia Lai in the full model and 19.22% in the reduced model. Consequently, the habitat suitability maps generated here provide a quantitative, spatially explicit foundation for identifying areas with high climatic suitability. When integrated with data on land tenure, current land use, and feasibility factors, these maps can support spatial prioritization for enrichment planting and guide climate-aware restoration planning for dry dipterocarp forests in Vietnam's Central Highlands.
Từ khóa
Central Highlands Vietnam, Dipterocarpus obtusifolius, dry dipterocarp forest, Gia Lai Province, MaxEnt, species distribution modelling (SDM)
Chi tiết bài viết
Introduction
Dry dipterocarp forests (also known as seasonally deciduous dipterocarp forests) represent a unique deciduous forest landscape of Southeast Asia in general and of Vietnam, particularly the Central Highlands, in particular. This forest type is ecologically distinctive, characterized by synchronous leaf shedding during the dry season, high levels of biological diversity, and the presence of numerous threatened and endemic species listed in national and international Red Data Books. Moreover, dry dipterocarp forests play a vital role in the global carbon cycle through their substantial capacity for carbon sequestration and storage in above-ground biomass. The vegetation community of this forest has evolved remarkable adaptations to prolonged dry seasons (lasting 5–6 months, with annual precipitation of only 900–1200 mm) and nutrient-poor soils (Kaewthongrach et al., 2019). It is considered a fire climax ecosystem, where periodic moderate wildfires are essential for the natural regeneration of dipterocarp species, while complete fire suppression promotes successional transition toward dry evergreen forests, leading to a decline in biodiversity (Michalko et al., 2024). These specific adaptations to nutrient-deficient and harsh environments confer upon dry dipterocarp forests high ecological and evolutionary research value, while also providing non-timber forest products, edible fungi, and wild food resources that support local livelihoods (Plybour et al., 2025).
Studies on dry dipterocarp forests have demonstrated that members of the Dipterocarpaceae family - such as Dipterocarpus obtusifolius, D. tuberculatus, Shorea obtusa, and Shorea siamensis - constitute the dominant tree species, accounting for up to 80% of total stand composition (Kaewthongrach et al., 2019; Wisitrassameewong et al., 2022). Among these, Dipterocarpus obtusifolius is recognized as a key fire-tolerant species, playing a crucial ecological role in maintaining forest structure and function. The species typically forms dense monospecific stands on sandy or nutrient-poor gray soils, under a distinct dry season lasting 3–6 months per year. Due to its high drought tolerance and economic importance for timber and resin production, D. obtusifolius is both a structural keystone species and an essential livelihood resource for local communities.
Nevertheless, in recent decades, the extent of dry dipterocarp forests across Vietnam - particularly in the Central Highlands - has declined sharply due to unsustainable logging, recurrent wildfires, and agricultural expansion. Additionally, extreme climatic events, such as the 2015–2016 El Nino, have exacerbated defoliation and tree mortality, indicating an overall degradation trend of dry dipterocarp forests across Southeast Asia (Kaewthongrach et al., 2019).
In Gia Lai Province, dry dipterocarp forests have been severely fragmented and reduced in area owing to overexploitation and conversion to rubber plantations and short-rotation crops. Most remaining stands are now degraded or impoverished secondary forests. Consequently, the restoration of dry dipterocarp ecosystems has become a critical management priority for provincial forestry authorities. Given the region’s extended dry-season climate and its historical dominance of dipterocarp species, enrichment planting with Dipterocarpus obtusifolius and related species represents a feasible and effective strategy for forest recovery. However, data on the species’ current distribution, ecological requirements, and restoration potential at the provincial scale remain limited, highlighting the need for ecological modeling approaches - such as MaxEnt - to support sustainable restoration planning.
To address the lack of ecological data and to guide forest restoration planning, Species Distribution Models (SDMs) have been widely applied in recent decades. Among these, the Maximum Entropy (MaxEnt) model has emerged as a powerful and versatile tool for predicting species distributions. MaxEnt estimates the probability distribution of maximum entropy based on presence-only data and a set of environmental variables. Compared with earlier models such as ENFA, BIOCLIM, and GARP, MaxEnt provides higher predictive accuracy, maintains robust performance with small sample sizes, and can handle both continuous and categorical predictors. Its continuous probability outputs are easily interpretable and suitable for spatial decision-making (Elith et al., 2011; Fourcade et al., 2014; Shan et al., 2025; Terribile et al., 2010). Consequently, MaxEnt has become a mainstream approach in ecological modeling, biodiversity conservation, and natural resource management (Wang et al., 2025).
Globally, numerous studies have demonstrated the efficacy of MaxEnt in predicting suitable habitats. Tesfamariam et al. (2022) applied MaxEnt to predict the potential distribution of Podocarpus falcatus in Ethiopia, achieving an AUC of 0.783 and identifying 48% of the study area as suitable for reforestation. Matsane et al. (2025) employed 105 occurrence records and 27 environmental variables to model the distribution of the medicinal plant Artemisia afra in South Africa, finding that 54.46% of the region had high suitability, with precipitation, NDVI, and soil type as key predictors. In the hot - dry valleys of Yunnan, China, MaxEnt was integrated with the InVEST habitat quality module to map suitable habitats for native tree species. The study emphasized that MaxEnt yields stable and accurate predictions, though field validation and germination experiments are essential for model refinement (Xie et al., 2025).
In Vietnam, MaxEnt has been increasingly applied using WorldClim Bioclimatic datasets to forecast species distributions and assess climate change impacts. WorldClim, developed by Fick & Hijmans (2017), provides 19 Bioclimatic variables at 1 km spatial resolution, derived from a global meteorological network (Hijmans et al., 2005). Vu et al. (2018) utilized MaxEnt to examine the climatic determinants of the southern yellow-cheeked gibbon (Nomascus gabriellae) across Vietnam and Cambodia. After removing highly correlated variables, eight key variables (four temperature and four precipitation parameters) were retained. The resulting model achieved an AUC > 0.92, indicating high accuracy, and predicted suitable habitats primarily in Dak Lak, Dak Nong, Lam Dong, and parts of Cambodia - consistent with field observations (Vu et al., 2018). More recently, a 2024 study on malaria vector mosquitoes (Anopheles dirus and A. minimus) in Central Vietnam reported an AUC ≈ 0.80, identifying temperature and humidity as the dominant environmental factors influencing habitat suitability (Tam et al., 2024). These examples underscore MaxEnt’s broad applicability across biological disciplines and the critical role of WorldClim as a high-quality climate data source for predictive modeling. Pham et al. (2024) developed multi-algorithm models - including Random Forest, Support Vector Machine, CART, Gradient Boosting Decision Tree, and MaxEnt - to predict habitat suitability for Cinnamomum parthenoxylon, a threatened Lauraceae species. Random Forest emerged as the best-performing algorithm, with top predictors including elevation, annual temperature range, and diurnal thermal amplitude. The models indicated that climatically suitable habitats are concentrated in northern and north-central Vietnam and may shift northeastward under future warming. Likewise, SDM-based analyses of mangrove ecosystems have been advanced by Yoon et al. (2024), who compiled a comprehensive dataset of 701 species records and 21 environmental variables to model the distribution of key mangrove genera across Vietnam’s coastline, demonstrating the influence of temperature seasonality, precipitation patterns, and soil characteristics on coastal vegetation dynamics.
A notable example is the study by Van Quy et al. (2025), which used MaxEnt to model the distributions of eleven Dipterocarpaceae species across southern Vietnam. The models achieved high accuracy (AUC = 0.840–0.977), demonstrating strong discriminatory power, and identified isothermality, elevation, annual precipitation, and dry-season rainfall as key determinants of species occurrence. Several species - Hopea ferrea, Dipterocarpus alatus, Anisoptera costata, Dipterocarpus dyeri, and Shorea roxburghii - were projected to experience significant contractions in climatically suitable habitat, highlighting potential vulnerability to warming and drying trends. In contrast, fire-tolerant taxa such as Dipterocarpus tuberculatus and Hopea odorata exhibited potential range expansion under future scenarios, suggesting differing adaptive capacities within the family (Van Quy et al., 2025). Overall, the growing body of SDM research in Vietnam - particularly on Dipterocarpaceae - provides critical insight into species’ ecological tolerances, potential climate refugia, and future conservation priorities. These modeling efforts not only reveal the environmental drivers that shape plant distributions but also offer a scientific foundation for climate-adaptive restoration strategies in biodiversity-rich yet increasingly threatened ecosystems such as the dry dipterocarp forests of the Central Highlands.
Building on this context, the present study employs the MaxEnt model to predict the potential distribution of Dipterocarpus obtusifolius in Gia Lai Province, located in the Central Highlands of Vietnam. Specifically, the study aims to: (1) Develop a species distribution model for D. obtusifolius using the MaxEnt approach; (2) Identify the key Bioclimatic variables that exert the strongest influence on the species’ spatial distribution through an initial model analysis incorporating 19 bioclimatic predictors; and (3) Assess in detail the potential distribution pattern by applying a refined subset of selected variables to enhance model precision. The findings provide robust scientific evidence to inform species conservation strategies and guide reforestation and ecological restoration initiatives targeting the dry dipterocarp forest ecosystems of Vietnam’s Central Highlands.
Materials and Methods
Study area
The study was conducted from April 2024 to June 2025 in Gia Lai Province (Central Highlands, Vietnam), bounded by 13°15′–15°01′ N and 107°27′–108°55′ E. Since this study was conducted from 2024 to June 2025, prior to the merger of Gia Lai and Binh Dinh provinces, the term “Gia Lai Province” in this paper refers to its former administrative boundaries as they existed before 1 July 2025. The landscape is dominated by basaltic plateaus interspersed with low hills and mountains, with a mean elevation of 700–800 m and ridges exceeding 1,500 m. The climate is tropical monsoonal with two distinct seasons: a wet season (May–October) contributing approximately 80– 90% of annual rainfall, and a dry season (November–April). Mean annual precipitation is approximately 2,200 mm, but seasonality is pronounced, ranging from approximately 406 mm in September to approximately 9 mm in January. These topo-climatic conditions form the ecological context for dry dipterocarp forests and the dominance of Dipterocarpaceae, including Dipterocarpus obtusifolius.
Presence records of D. obtusifolius were collected along dry dipterocarp and semi-evergreen forest habitats (Figure 1). The transect network comprised: (i) Chu Prong - Ia Puch Protection Forest (dry dipterocarp), (ii) Chu Prong - Ia Meur Protection Forest (dry dipterocarp), (iii) National Road 14C: Ia Meur - Ia Puch - Duc Co (dry dipterocarp on sandy/infertile gray soils), (iv) National Road 25 - Nam Song Ba Protection Forest (semi-evergreen), and (v) National Road 25 - Ia Tul Protection Forest (semi-evergreen). At each transect, stop points were established along gradients of seasonal aridity, soil type, and microtopography. GPS coordinates and habitat descriptions were recorded to compile a presence-only dataset for MaxEnt modeling. Representative locations of recorded presences are shown as red dots in Figure 1.
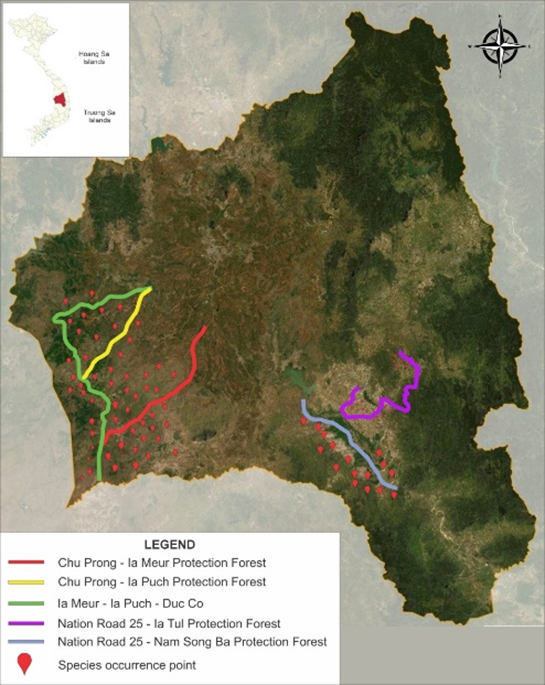
Figure 1. Location of Gia Lai Province and survey transects
Data collection
To parameterize the MaxEnt models, we compiled two primary data streams: (i) species occurrence records consisting of geographic coordinates referenced to WGS 84, collected during field surveys; and (ii) environmental predictors in raster format representing ecological conditions constraining the species’ distribution (Kaewthongrach et al., 2019; Michalko et al., 2024; Plybour et al., 2025). Occurrences of Dipterocarpus obtusifolius were recorded along predefined transects within protection forests across Gia Lai Province. To limit spatial duplication and reduce spatial autocorrelation, records were thinned to a minimum nearest-neighbor distance of 1 km prior to analysis (Kiedrzyński et al., 2017). After duplicate removal and coordinate quality control, 119 presence points were retained. The dataset was randomly split into 90 records (75%) for training and 29 records (25%) for testing.
Environmental predictors were obtained from WorldClim v2.1 (baseline period 1991 - 2020) at 30-arc-second (~1 km) resolution. All raster layers were clipped to the Gia Lai provincial boundary, standardized to a common spatial reference, and resampled to a uniform grid. We used the 19 bioclimatic variables (BIO 01 - BIO 19) as candidate predictors to characterize climatic constraints on the species’ distribution. The statistical downscaling approach used to generate high-resolution climate surfaces followed the methodology described by Hijmans et al., (2005). A complete list and brief description of the predictors used in modeling are provided in Table 1.
Table 1. Bioclimatic variables (WorldClim v2.1) used in the model
Code | Variable | Unit | Brief description |
BIO 01 | Annual Mean Temperature | °C | Mean of monthly temperatures across the year. |
BIO 02 | Mean Diurnal Range | °C | Mean of monthly (Tmax - Tmin). |
BIO 03 | Isothermality | % | Ratio BIO2/BIO7 × 100; relates daily to annual temperature variability. |
BIO 04 | Temperature Seasonality | - | Standard deviation of monthly temperature × 100; magnitude of intra-annual variability. |
BIO 05 | Max Temperature of Warmest Month | °C | Monthly maximum temperature of the warmest month. |
BIO 06 | Min Temperature of Coldest Month | °C | Monthly minimum temperature of the coldest month. |
BIO 07 | Temperature Annual Range | °C | Difference BIO5 - BIO6. |
BIO 08 | Mean Temperature of Wettest Quarter | °C | Mean temperature of the three wettest consecutive months. |
BIO 09 | Mean Temperature of Driest Quarter | °C | Mean temperature of the three driest consecutive months. |
BIO 10 | Mean Temperature of Warmest Quarter | °C | Mean temperature of the three warmest consecutive months. |
BIO 11 | Mean Temperature of Coldest Quarter | °C | Mean temperature of the three coldest consecutive months. |
BIO 12 | Annual Precipitation | mm | Sum of monthly precipitation across the year. |
BIO 13 | Precipitation of Wettest Month | mm | Precipitation in the wettest month. |
BIO 14 | Precipitation of Driest Month | mm | Precipitation in the driest month. |
BIO 15 | Precipitation Seasonality (CV) | % | Coefficient of variation of monthly precipitation. |
BIO 16 | Precipitation of Wettest Quarter | mm | Total precipitation in the wettest consecutive 3-month period. |
BIO17 | Precipitation of Driest Quarter | mm | Total precipitation in the driest consecutive 3-month period. |
BIO18 | Precipitation of Warmest Quarter | mm | Total precipitation in the warmest consecutive 3-month period. |
BIO19 | Precipitation of Coldest Quarter | mm | Total precipitation in the coldest consecutive 3-month period. |
Notes: “Quarter” refers to a three-month period defined from monthly climate time series. Temperature is expressed in °C and precipitation in mm. If native WorldClim layers are scaled (e.g., ×10), values were converted to standard units prior to modeling. Source: WorldClim v2.1, 30″ ( 1 km) resolution.
Research methods
We implemented a five-stage MaxEnt workflow (Elith et al., 2011).
(i) Data preparation and preprocessing: Presence records were quality-controlled to remove duplicates and suspect coordinates; environmental rasters were harmonized to a common resolution, projection, and spatial extent prior to modeling. To reduce potential spatial sampling bias and spatial autocorrelation in the occurrence dataset, we (i) removed duplicate records, and (ii) applied spatial thinning to a minimum nearest-neighbor distance of 1 km, matching the ~1 km resolution of WorldClim predictors. This step reduces clustering along survey routes and limits pseudo-replication among nearby presence points. We acknowledge that residual sampling bias may still persist (e.g., higher sampling intensity near accessible areas), and that remaining spatial autocorrelation can inflate discrimination metrics when random cross-validation is used.
(ii) Background definition and accessible area (M): We defined the accessible area (M) as the Gia Lai provincial boundary because the study’s objective is to provide a province-scale suitability map for restoration prioritization within the administrative unit used for forestry planning and management. To characterize the environmental domain for model calibration and mapping, 10,090 background points were uniformly sampled within the study area. Following the MaxEnt user guide, this dataset comprised 10,000 simulated pseudo-absence points and the 90 actual species presence records, ensuring an adequate baseline density. We acknowledge that alternative definitions of M (e.g., restricting background to the mapped dry dipterocarp belt, edaphic zones, or surveyed buffers) could affect predicted suitability patterns and evaluation statistics by changing the environmental contrast between presence points and background.
(iii) Model configuration and fitting: Models were fitted in MaxEnt v3.4.4 (Java) using 15-fold cross-validation; at each fold, 25% of samples served as an internal test set for AUC calculation and the remainder for training. Allowed feature classes were linear, quadratic, product, and hinge; the regularization multiplier was set to 1.0 to mitigate overfitting. The use of a regularization multiplier (RM = 1.0) alongside linear, quadratic, product, and hinge feature classes helped constrain model flexibility and minimize overfitting. The effectiveness of these settings in managing complexity was assessed through the comparison between training and testing performance across cross-validation folds, and the ecological plausibility and smoothness of response curves and jackknife results. Additionally, a full model incorporating all 19 bioclimatic variables was compared with a reduced-variable model to minimize redundancy and enhance generalizability. Outputs were requested in logistic format (0 - 1) to facilitate probabilistic interpretation. These settings are set by default according to the MaxEnt software user manual by Elith J. (2011) (Elith et al., 2011). The first model analysis included all 19 bioclimatic predictors to assess relative importance and screen variables; the second model analysis refit the model with the selected subset to refine the potential distribution.
(iv) Model evaluation: Performance was quantified using AUC (area under the ROC curve) and TSS (True Skill Statistic). Following common practice, AUC > 0.9 indicates excellent discrimination (Shan et al., 2025), while TSS complements AUC by jointly balancing sensitivity and specificity. At the “maximum sensitivity + specificity” threshold, TSS = 1 - test omission - area, where test omission is the proportion of presence records predicted absent and area is the fraction of background predicted present (i.e., false-positive rate). Under standard interpretation, TSS > 0.75 denotes very good predictive skill (Yahaya et al., 2025).
(v) Interpretation and mapping: Logistic outputs were reclassified into suitability classes. These layers were overlaid with provincial base maps in MaxEnt to compute class-wise habitat areas and to prioritize sites for enrichment planting and restoration of dry dipterocarp forests. Based on the results of the MaxEnt model, the predicted distribution area can be calculated by applying the “Equate entropy of thresholded and original distributions” and the “10 percentile training presence” thresholds to the continuous habitat suitability map. Equate Entropy Threshold represents a commonly used balanced threshold for converting the continuous suitability raster (values 0-1) into a binary presence/absence map. Pixels with a suitability value equal to or greater than this threshold are classified as “potentially suitable habitat”. 10 Percentile Training Presence Threshold excludes the 10% of training presence records with the lowest predicted suitability. Pixels must have a suitability value equal to or greater than this threshold to be classified as “highly suitable habitat” (Elith et al., 2011).
Results
Effects of bioclimatic predictors
In the full 19-predictor model analysis, a subset of bioclimatic variables exerted clearly dominant effects on the distribution of D. obtusifolius. By percent contribution, BIO 08 (mean temperature of the wettest quarter) accounted for 28.7%, followed by BIO 05 (max temperature of the warmest month) (22.1%), BIO 09 (mean temperature of the driest quarter) (9.9%), BIO02 (mean diurnal range) (7.5%), BIO 14 (precipitation of the driest month) (5.9%), BIO18 (precipitation of the warmest quarter) (5.24%), and BIO 17 (precipitation of the driest quarter) (4.1%). Other predictors (e.g., BIO 10, BIO 12) each contributed < 4%.
By permutation importance - quantifying the AUC drop upon randomizing a variable - BIO14 ranked highest (66.7%), ahead of BIO 02 (7.7%) and BIO 18 (5.4%). Hence, while BIO 08 and BIO 05 explain a large share of fitted variance, BIO 14 carries the most unique (non-redundant) information tied to dry-season water limitation, a key determinant of species occurrence.
Table 2. Variable contributions and permutation importance (normalized, %)
Variable | Percent contribution % | Permutation importance % | Variable | Percent contribution % | Permutation importance % |
BIO 08 | 28.7 | 3.4 | BIO 13 | 2.5 | 1 |
BIO 05 | 22.1 | 0.1 | BIO 06 | 2.4 | 0.4 |
BIO 09 | 9.9 | 1.2 | BIO 15 | 1.7 | 2.8 |
BIO 02 | 7.5 | 7.7 | BIO 01 | 1 | 0 |
BIO 14 | 5.9 | 66.7 | BIO 04 | 0.6 | 2.6 |
BIO 18 | 5.2 | 5.4 | BIO 19 | 0.2 | 2.2 |
BIO 17 | 4.1 | 3.9 | BIO 07 | 0 | 0.3 |
BIO 10 | 2.9 | 1.5 | BIO 03 | 0 | 0 |
BIO 12 | 2.8 | 0 | BIO 11 | 0 | 0 |
BIO 16 | 2.6 | 0.7 |
|
|
|
Note: Values rounded from MaxEnt output; sums may not equal 100% due to rounding.
Variable selection was based on the cumulative contribution of predictors in a preliminary MaxEnt model (Kiedrzyński et al., 2017). The subset of variables accounting for over 80% of the total contribution was retained for the final, reduced model. This procedure identified seven key bioclimatic factors: BIO08, BIO05, BIO09, BIO02, BIO14, BIO18, and BIO17. The reduced model thus preserves the primary environmental drivers of distribution while effectively minimizing variable redundancy and multicollinearity.
The MaxEnt jackknife test (Figure 2) corroborates the primacy of BIO 08 (mean temperature of the wettest quarter) and BIO05 (maximum temperature of the warmest month). When used in isolation, BIO 08 yields the highest training gain, indicating it carries the greatest explanatory power for the species’ distribution. Conversely, in the leave-one-out scenario (training gain without variable), BIO 18 (precipitation of the warmest quarter) produces the largest drop in gain, demonstrating that warm-season precipitation provides non-redundant, irreplaceable information relative to other predictors. These outcomes are consistent with permutation importance, underscoring the controlling role of warm/dry-season hydrothermal regimes in structuring suitable habitat for D. obtusifolius.
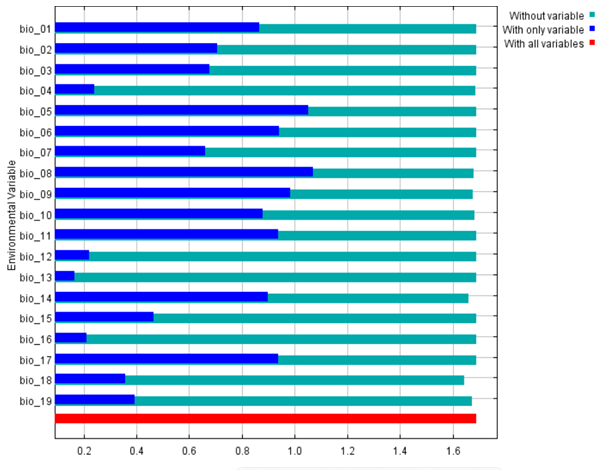
Figure 2. The MaxEnt jackknife test for 19 environmental variables
Potential distribution model of Dipterocarpus obtusifolius based on key bioclimatic predictors
Based on Table 2, the seven highest-contributing predictors were retained for the second model analysis: BIO 08, BIO 05, BIO 02, BIO 14, BIO 18, BIO 17, and BIO 09. As summarized in Table 3, BIO 05 and BIO 02 dominated percent contribution (25.1% and 23.1%, respectively), followed by BIO08 (19.3%), BIO14 (16.3%), and BIO18 (9.0%). In terms of permutation importance, BIO14 (54.9%) again emerged as the most non-redundant predictor, followed by BIO02 (21.0%). The increased weights of BIO14 and BIO02 in the reduced model underscore the irreplaceable roles of diurnal temperature range and dry-season precipitation in shaping the species’ suitable habitat.
Table 3. Variable contributions and permutation importance for the reduced model (7 predictors; normalized, %)
Variable | Percent contribution (%) | Permutation importance (%) | Appropriate value threshold |
bio 05 Max Temperature of Warmest Month | 25.1 | 5.5 | 30.1 – 34 ℃ |
bio 02 Mean Diurnal Range | 23.1 | 21 | 9.1 – 10 ℃ |
bio 08 Mean Temperature of Wettest Quarter | 19.3 | 0.5 | > 24 ℃ |
bio 14 Precipitation of Driest Month | 16.3 | 54.9 | 0 - 5 mm |
bio 18 Precipitation of Warmest Quarter | 9 | 9.2 | < 500 mm |
bio 17 Precipitation of Driest Quarter | 5.4 | 8.3 | < 30 mm |
bio 09 Mean Temperature of Driest Quarter | 1.7 | 0.6 | > 22 ℃ |
The jackknife test (Figure 3) indicated that BIO 05 and BIO 08 are the most informative predictors: when used in isolation (training gain with only variable), both yield the highest training gains. In the leave-one-out setting (training gain without variable), removing BIO 18 produces the largest drop in gain, demonstrating that precipitation of the warmest quarter provides unique, non-redundant information that cannot be substituted by other predictors.
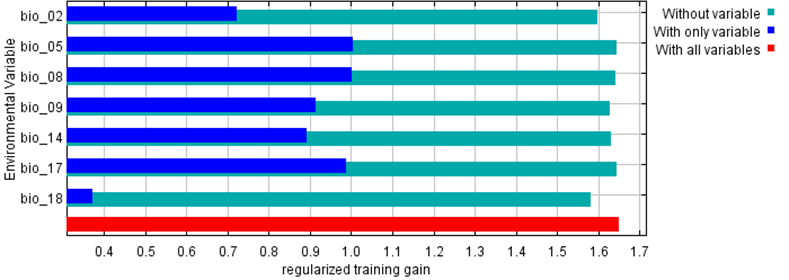
Figure 3. The MaxEnt jackknife test for 7 environmental variables
MaxEnt model performance
Model skill for the full (19-predictor) and reduced (7-predictor) configurations was evaluated using AUC and TSS under 15-fold cross-validation. Both models exhibited excellent discrimination (AUC > 0.90) and very good predictive skill by TSS (≈ 0.83). The test-AUC standard deviation (≈ 0.009) was consistently low, indicating high stability across folds. Table 4 summarizes the performance metrics, and Figure 4 presents ROC curves with a steep initial rise and clear separation from the random diagonal - evidence of high TPR at low FPR. Because random cross-validation may not ensure spatial independence between training and testing subsets, residual spatial autocorrelation can yield optimistic AUC/TSS estimates. We therefore interpret AUC/TSS primarily as internal discrimination within the sampled environmental space, and we report fold-to-fold stability to indicate robustness under the current validation scheme.
On the ROC plot, the models correctly identify most presences while rarely misclassifying background points as suitable. Here, TPR (True Positive Rate = TP/(TP+FN), also sensitivity/recall) quantifies the proportion of presence records predicted present, whereas FPR (False Positive Rate = FP/(FP+TN) = 1 − specificity) quantifies the proportion of background predicted present. The ROC curve arching toward the upper-left corner indicates strong discrimination: at reasonable thresholds, the models maintain high TPR with low FPR, consistent with AUC > 0.90 and TSS ≈ 0.83. Note that in MaxEnt, false positives are assessed against background (not true absences); therefore, map interpretation should be complemented with land-use/soil layers and ground validation. Training and test metrics were similar across replicates, and response curves were smooth and ecologically interpretable, suggesting limited overfitting with the selected RM and feature classes.
Table 4. MaxEnt performance
No | Model information | MaxEnt with 19 variables | MaxEnt with 7 variables | Note |
1 | Algorithm converged | 1280 iterations | 1020 iterations | Iterations to convergence |
2 | Training AUC | 0.9422 | 0.9398 | Excellent |
3 | Test AUC | 0.9294 | 0.9311 | excellent |
4 | AUC Standard Deviation | 0.0086 | 0.0092 | Highly stable |
5 | Maximum training sensitivity plus specificity area | 0.1437 | 0.1562 |
|
6 | Maximum training sensitivity plus specificity test omission | 0.069 | 0.0345 |
|
7 | TSS train = 1 - (5) - (6) | 0.7873 | 0.8093 | Very good |
8 | Maximum test sensitivity plus specificity area | 0.1772 | 0.161 |
|
9 | Maximum test sensitivity plus specificity training omission | 0.0111 | 0.0111 |
|
10 | TSS test = 1 - (8) - (9) | 0.8117 | 0.8279 | Very good |
Notes: AUC = Area Under the ROC Curve; TSS = True Skill Statistic.
Performance assessment (Table 4) indicates high model accuracy for both configurations. For the 19-predictor model, the algorithm converged after 1280 iterations, yielding training AUC = 0.9422 and test AUC = 0.9294. For the 7-predictor model, convergence occurred after 1020 iterations, with training AUC = 0.9398 and test AUC = 0.9311. Under the commonly used interpretation (AUC > 0.90 = excellent), both models exhibit excellent discrimination. Likewise, TSS train and TSS test are > 0.75 for both models (0.7873/0.8117 for 19 predictors; 0.8093/0.8279 for 7 predictors), denoting very good predictive skill (Dai et al., 2018; Shan et al., 2025). The ROC curves in Figure 4 arch toward the upper-left corner with a steep initial rise and clear separation from the random diagonal, consistent with high TPR at low FPR - i.e., the models correctly identify most presences while rarely misclassifying background as suitable.
Importantly, the test-AUC standard deviation is low (0.0086–0.0092) for both models, indicating high stability across folds and consistent across the folds under the current evaluation scheme. The results imply that the spatial distribution of the 119 presence records is adequate, and that the chosen bioclimatic variables appear to reflect meaningful ecological patterns. As a result, the model seemed to achieve fast convergence with relatively low variance. Overall, the concordant evidence from AUC, TSS, and ROC shape supports MaxEnt’s reliability for inferring potential distribution and provides a robust scientific basis for conservation planning and restoration of Dipterocarpus obtusifolius in Gia Lai. Both ROC curves arch toward the upper-left corner and are clearly separated from the random diagonal, confirming high TPR at low FPR (the models correctly identify most presences while rarely misclassifying background as suitable). The small train - test AUC gap (0.011 for 19 predictors; 0.009 for 7 predictors) indicated no evident overfitting. Notably, the 7-predictor model attains a slightly higher test AUC (0.931 vs. 0.929), consistent with reduced redundancy while maintaining excellent discrimination.
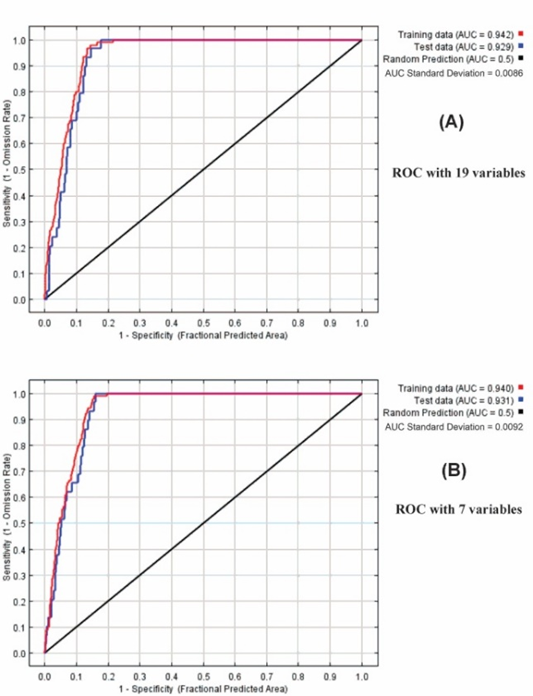
Figure 4. ROC curves for two MaxEnt configurations
Thresholds and potential habitat area
MaxEnt offers several decision thresholds to convert continuous logistic outputs into binary suitability. We adopted the “equate entropy of thresholded and original distributions” threshold because it balances omission rate and predicted area, avoiding overly conservative maps while limiting overprediction.
- Model analysis 1 (19 predictors): logistic threshold 0.1636; fractional predicted area = 18.47%, which translates to ≈ 2,869 km² over Gia Lai’s ≈ 15,536 km²
- Model analysis 2 (7 predictors): fractional predicted area = 19.22%, i.e., ≈ 2,986 km².
Relative to the 19-predictor model, the reduced model yields a larger predicted area, consistent with reduced redundancy and greater weighting of key predictors (notably BIO14 and BIO02). This aligns with permutation importance, underscoring the primacy of dry-season hydroclimate and diurnal thermal range in structuring suitability. For reference, using the “maximum sensitivity + specificity” threshold produces smaller fractional areas (≈ 17.72% in Model analysis 1 and ≈ 16.10% in Model analysis 2), highlighting the threshold sensitivity of area estimates. In practice, we recommend a dual-view: a stricter threshold for core restoration priorities and the equate-entropy threshold to represent broader restoration potential.
Table 5. Potential habitat area under MaxEnt thresholds
No | Model Informations | MaxEnt with 19 variables | MaxEnt with 7 variables | ||
Ratio (%) | Acreage (km2) | Ratio (%) | Acreage (km2) | ||
1 | Equate entropy of thresholded and original distributions area (Maximum potential distribution area) | 18.47 | 2869 | 19.22 | 2986 |
2 | 10 percentile training presence area (Optimal potential distribution area ratio) | 11.77 | 1828 | 12.32 | 1914 |
Beyond the equate entropy threshold, MaxEnt also delineated an optimal (core) habitat using the 10th-percentile training presence criterion, which removes the lowest-suitability 10% of presence records to emphasize high-confidence core areas. Under the 7-predictor model, the core area accounts for 12.32% of the province, i.e., approximately 1,914 km². Compared with the broader potential area under equate entropy
(19.22%; 2,986 km²), this core extent is smaller but better suited for restoration prioritization by intended to reduce potential overprediction. Figure 5 presents the potential distribution map of Dipterocarpus obtusifolius, where high-suitability clusters delineate contiguous tracts that are higher-confidence areas for targeted restoration.
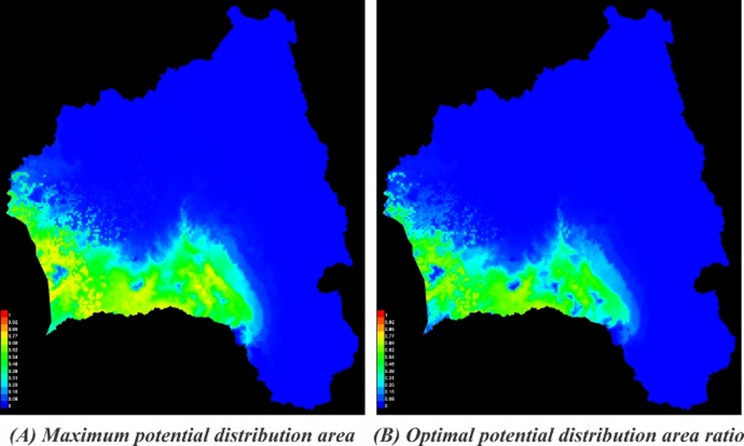
Figure 5. Potential distribution maps of Dipterocarpus obtusifolius under two MaxEnt thresholds
The color ramp shows logistic suitability (0 - 1): dark blue = unsuitable/low, green = moderate, yellow - red = high. Both maps highlight a southern - southeastern belt of suitability consistent with dry-season aridity. Panel (b) delineates core restoration targets, while panel (a) indicates broader restoration potential.
Discussion
The MaxEnt results demonstrate very high predictive performance under both scenarios (AUC > 0.93; TSS ≈ 0.83), confirming the suitability of MaxEnt for presence-only species distribution analysis. Reducing predictors from 19 to 7 did not degrade accuracy; instead, it mitigated multicollinearity and enhanced ecological interpretability. The key bioclimatic drivers align with the species’ ecology: mean temperature of the wettest quarter (BIO 08) and maximum temperature of the warmest month (BIO 05) relate to heat tolerance during the prolonged dry season; a high mean diurnal range (BIO 02) indicates adaptation to large day - night thermal amplitudes typical of highland climates. Concurrently, precipitation of the driest month (BIO14) and precipitation of the driest quarter (BIO 17) highlight sensitivity to dry-season water stress, consistent with dry dipterocarp forests being fire-adapted systems that require moderate fire regimes for regeneration. The jackknife further shows BIO 18 (precipitation of the warmest quarter) provides non-redundant, independent information, implying that shoulder-season rainfall affects germination and early growth (Michalko et al., 2024).
A test AUC near 0.93 is comparable to international studies on tropical species: in Taraba, Nigeria, MaxEnt achieved AUC 0.985 for canopy and subcanopy trees with dry-season temperature - precipitation as primary controls (Yahaya et al., 2025); in Nepal, Dalbergia latifolia reached AUC = 0.969, with elevation and temperature of the driest quarter as dominant predictors (Mahatara et al., 2021). Studies on tropical herbs (e.g., Lophatherum gracile in China) also reported AUC > 0.9 and TSS > 0.7, with driest-month rainfall, elevation, and soil moisture as key factors (Lu et al., 2025). Collectively, these benchmarks corroborate that thermal extremes and dry-season precipitation commonly govern tropical plant distributions. Accordingly, our AUC ≈ 0.93 and TSS ≈ 0.83 align with international standards, supporting MaxEnt’s effectiveness for tropical tree SDMs and the representativeness of a modest presence sample.
Compared with other Dipterocarpaceae SDM studies in Vietnam, our results for Dipterocarpus obtusifolius align strongly with the ecological signature of deciduous dipterocarp species. Van Quy et al. (2025) showed that many evergreen or semi-evergreen dipterocarps - such as Dipterocarpus alatus, D. dyeri, Hopea odorata, and Anisoptera costata - are primarily constrained by wet-season precipitation and soil moisture, leading to projected contractions under warmer and drier future climates. In contrast, D. obtusifolius and other xeric-adapted species like D. tuberculatus displayed broader climatic tolerance and more stable or slightly expanding distributions. This contrast underscores the ecological divergence within Dipterocarpaceae: evergreen species occupy moist closed forests, whereas deciduous species are adapted to high temperatures, nutrient-poor soils, and pronounced dry seasons typical of Dipterocarpus ecosystems. Our findings therefore reinforce the unique resilience of D. obtusifolius relative to moisture-dependent dipterocarps, suggesting distinct conservation strategies for each ecological group.
Regarding classification thresholds, the logistic threshold determines conversion from probability to binary suitability. The 10th-percentile training presence threshold delineates core habitat covering 11.77% of the province with 10% omission, suitable for restoration prioritization. The maximum test sensitivity + specificity threshold expands suitable area to 17.7% with 1.1% omission, appropriate for broad potential assessments. The thresholds applied here yield two actionable habitat layers: the 10th-percentile training presence threshold identifies core habitats (11.77% of Gia Lai) that are suitable targets for priority restoration and planting; the maximum sensitivity + specificity threshold expands the potential distribution to 17.7%, useful for landscape-level conservation planning. Spatially, high-suitability belts cluster across southern - southeastern Gia Lai - areas of sandy/infertile gray soils and prolonged dry seasons - which matches field observations. Restricting the background to ecologically accessible dry dipterocarp habitats would likely reduce extrapolation into non-target environments and may produce more conservative suitability predictions outside the dry-forest belt. However, a narrower background often increases similarity between presences and background and can lower AUC/TSS by making discrimination more difficult. Conversely, restricting background only to surveyed areas may underrepresent potentially suitable but unsurveyed sites, which are relevant for restoration planning and spatial prioritization.
It is important to acknowledge the inherent limitations of our modeling approach. Although AUC/TSS values were high, strong discrimination does not necessarily guarantee transferability. We therefore interpret model performance together with stability across folds and ecological plausibility of response curves. A more formal tuning framework (e.g., testing multiple RM/feature-class combinations using omission rates and information criteria) could further optimize complexity control and is recommended for future applications. As a presence-only method, MaxEnt models potential rather than realized distribution, and our models are constrained by the available climatic and topographic data. Key biophysical factors known to influence dipterocarp establishment - such as detailed soil chemistry, fire history, and land-use/land-cover change - were not included and likely explain some omission errors. Regarding potential spatial bias and spatial autocorrelation, we note that presence-only SDMs can show inflated evaluation scores if occurrences are spatially clustered and training/testing folds are not geographically independent. While thinning at 1 km reduces this effect, future work could apply spatially blocked cross-validation and/or bias-informed background sampling to provide a more conservative assessment of predictive performance. Furthermore, the static nature of the model does not account for climate change impacts, biotic interactions (e.g., pollinators, competitors), or dispersal limitations. Therefore, while the model excellently identifies climatically suitable areas, these results should be viewed as a critical first filter. Effective conservation and restoration planning requires integrating these suitability maps with layers on current forest cover, protected area status, fire risk, and soil properties, followed by mandatory ground-truthing to confirm site-specific viability.
Conclusion
This study demonstrates that MaxEnt, using limited presence records and WorldClim bioclimatic predictors, can accurately predict the potential distribution of Dipterocarpus obtusifolius in Gia Lai Province. Both the 19-predictor and 7-predictor configurations achieved AUC > 0.93 and TSS ≈ 0.83; the reduced model maintained comparable accuracy while improving ecological interpretability. Key climatic drivers include the mean temperature of the wettest quarter (BIO08), maximum temperature of the warmest month (BIO05), mean diurnal temperature range (BIO02), and dry-season precipitation - in particular precipitation of the driest quarter (BIO17) (with precipitation of the driest month - BIO14 also providing strong, non-redundant information in permutation/jackknife tests). Suitable habitat encompasses ~18 - 19% of the province (~2800 - 3000 km²), with high-suitability core areas covering ~11 - 12%.
These results provide a robust scientific basis for site selection in enrichment planting, the design of ecological corridors, and the allocation of restoration resources. For implementation, model outputs should be combined with field verification, edaphic/topographic/land-cover layers, and management factors such as harvesting pressure, fire regimes, and agricultural encroachment. Future work should extend to climate-change scenarios to inform long-term restoration strategies for dry dipterocarp forests in Vietnam’s Central Highlands.
Funding: The authors would like to express their sincere gratitude to the Vietnam- Russia Tropical Science and Technology Research Center for providing research facilities and logistical assistance throughout the study.
Acknowledgements: The authors would like to express their sincere gratitude to the Vietnam- Russia Tropical Science and Technology Research Center for providing research facilities and logistical assistance throughout the study.
Data Availability Statement: The data supporting the findings of this study are available from the corresponding author upon reasonable request
Author contributions: Dang Hung Cuong: Conceptualization, Project Administration, Methodology, Writing - Original Draft; Nguyen Dang Hoi: Supervision, Methodology, Validation; Nguyen Huu Hiep: Resources, Investigation; Dang Ngoc Huyen: Data Curation, Writing - Review & Editing, Nguyen Thi Tuyet Nhung: Data Curation, Formal Analysis; Chau Bao Duy: Investigation, Visualization.
Statement on the use of Generative AI: The authors declare that AI tools were used only for language editing/formatting, and not for generating scientific content. All data, analyses, and interpretations were performed and verified by the authors, who take full responsibility for the manuscript.
Conflict of interest statement: The authors declare no conflict of interest.
Tài liệu tham khảo
Dai, G., Yang, J., Lu, S., Huang, C., Jin, J., Jiang, P., & Yan, P. (2018). The potential impact of invasive woody oil plants on protected areas in China under future climate conditions. Scientific Reports, 8(1), 1041. https://doi.org/10.1038/s41598-018-19477-w
Elith, J., Phillips, S. J., Hastie, T., Dudík, M., Chee, Y. E., & Yates, C. J. (2011). A statistical explanation of MaxEnt for ecologists. Diversity and Distributions, 17(1), 43-57. https://doi.org/10.1111/j.1472-4642.2010.00725.x
Fourcade, Y., Engler, J. O., Rödder, D., & Secondi, J. (2014). Mapping species distributions with MAXENT using a geographically biased sample of presence data: a performance assessment of methods for correcting sampling bias. PloS One, 9(5), e97122.https://doi.org/10.1371/journal.pone.0097122
Hijmans, R. J., Cameron, S. E., Parra, J. L., Jones, P. G., & Jarvis, A. (2005). Very high resolution interpolated climate surfaces for global land areas. International Journal of Climatology: A Journal of the Royal Meteorological Society, 25(15), 1965-1978. https://doi.org/10.1002/joc.1276
Kaewthongrach, R., Vitasse, Y., Lamjiak, T., & Chidthaisong, A. (2019). Impact of severe drought during the strong 2015/2016 El Nino on the phenology and survival of secondary dry dipterocarp species in Western Thailand. Forests, 10(11), 967. https://doi.org/10.3390/f10110967
Kiedrzyński, M., Zielińska, K. M., Rewicz, A., & Kiedrzyńska, E. (2017). Habitat and spatial thinning improve the MaxEnt models performed with incomplete data. Journal of Geophysical Research: Biogeosciences, 122(6), 1359-1370. https://doi.org/10.1002/2016JG003629
Lu, Z., Wang, G., Shao, Y., Yan, L., Huang, L., Fan, Z., Han, S., Ren, X., Han, R., Zhang, C., Ou, J., & Tong, X. (2025). Assessing the impacts of climate change and human activities on distribution of Lophatherum gracile in China using the maxent model. Scientific Reports, 15(1), 29945. https://doi.org/10.1038/s41598-025-15693-3
Mahatara, D., Acharya, A. K., Dhakal, B. P., Sharma, D. K., Ulak, S., & Paudel, P. (2021). Maxent modelling for habitat suitability of vulnerable tree Dalbergia latifolia in Nepal. Silva Fennica, 55(4), Article 10441. https://doi.org/10.14214/sf.10441
Matsane, W., Dhau, I., Mothapo, M. C., & Thamaga, K. H. (2025). Modelling the potential distribution of African Wormwood (Artemisia afra) using a Machine Learning Algorithm-Based Approach (MaxEnt) in Sekhukhune District, South Africa. Ecology and Evolution, 15(8), e71866. https://doi.org/10.1002/ece3.71866
Michalko, R., Songsangchote, C., Saksongmuang, V., Wongprom, P., Trisurat, Y., & Košulič, O. (2024). Transformation of dry dipterocarp to dry evergreen forests alters food webs of web-building spiders and their prey. Journal of Insect Conservation, 28, 1363 - 1373. https://doi.org/10.1007/s10841-024-00634-8
Pham, M. P., Vu, D. D., Nguyen, T. T., & Nguyen, V. S. (2024). Predictive ecological niche model for Cinnamomumparthenoxylon (Jack) Meisn. (Lauraceae) from Last Glacial Maximum to future in Vietnam. Biodiversity Data Journal, 12, e122325. https://doi.org/10.3897/BDJ.12.e122325
Plybour, C., Laosuwan, T., Uttaruk, Y., Awichin, P., Rotjanakusol, T., Itsarawisut, J., & Singharath, M. (2025). An Investigation of plant species diversity, above-ground biomass, and carbon stock: Insights from a dry dipterocarp forest case study. Diversity, 17(6), 428. https://doi.org/10.3390/d17060428
Shan, Y., Shen, H., Huang, L., Hamezah, H. S., Han, R., Ren, X., Zhang, C., & Tong, X. (2025). Optimized MaxEnt analysis revealing the change of potential distribution area of Lygodium japonicum in China driven by global warming. Frontiers in Plant Science, 16, 1601956. https://doi.org/10.3389/fpls.2025.1601956
Tam, L. T., Thinkhamrop, K., Suttiprapa, S., & Suwannatrai, A. T. (2024). Potential distribution of malaria vectors in Central Vietnam: A MaxEnt modeling approach. Veterinary World, 17(7), 1514-1522. https://doi.org/10.14202/vetworld.2024.1514-1522
Terribile, L. C., Diniz-Filho, J. A., & De Marco, P., Jr (2010). How many studies are necessary to compare niche-based models for geographic distributions? Inductive reasoning may fail at the end. Brazilian Journal of Biology = Revista Brasleira de Biologia, 70(2), 263-269. https://doi.org/10.1590/s1519-69842010000200005
Tesfamariam, B. G., Gessesse, B., & Melgani, F. (2022). MaxEnt-based modeling of suitable habitat for rehabilitation of Podocarpus forest at landscape-scale. Environmental Systems Research, 11(1), 4. https://doi.org/10.1186/s40068-022-00248-6
Van Quy, N., Rodríguez-Hernández, D. I., & Tuan, N. T. (2025). Projected climate-induced range shifts of Dipterocarpaceae in Vietnam's Southeast and Central Highlands. Environmental Monitoring and Assessment, 197(8), 841. https://doi.org/10.1007/s10661-025-14308-8
Vu, T. T., Tran, V.-D., Luu, Q.-V., & Ta, T.-N. (2018). Using MaxEnt to assess the impact of climate change on the distribution of southern yellow-cheeked crested gibbon (Nomascus gabriellae). Management of Forest Resources and Environment, 2, 131-140.
Wang, Y., Ren, X., Wang, K., Lin, W., Wang, P., Liu, Z., Zhang, H., & Zhou, N. (2025). Maxent model-based prediction of the potential distribution of Fritillaria taipaiensis P. Y. Li. Scientific Reports, 15(1), 20837. https://doi.org/10.1038/s41598-025-01682-z
Wisitrassameewong, K., Manz, C., Hampe, F., Looney, B. P., Boonpratuang, T., Verbeken, A., Thummarukcharoen, T., Apichitnaranon, T., Pobkwamsuk, M., Caboň, M., & Adamčík, S. (2022). Two new Russula species (fungi) from dry dipterocarp forest in Thailand suggest niche specialization to this habitat type. Scientific Reports, 12(1), 2826. https://doi.org/10.1038/s41598-022-06836-x
Xie, M., Song, X., Zhang, X., Ma, Y., Song, Z., Li, F., Li, W., Fan, L., & Ma, H. (2025). Suitability mapping of native tree species in dry-hot valleys of Yunnan based on InVEST-MaxEnt coupled modeling: model validation framework with native tree species actual distribution and seed germination. Frontiers In Plant Science, 16, 1577623. https://doi.org/10.3389/fpls.2025.1577623
Yahaya, I. I., Wang, C., Ogbue, C. P., & Yahaya, M. S. (2025). Remote sensing and MaxEnt modeling of canopy and non-canopy forest tree species in Taraba State for biodiversity conservation and ecosystem management. Frontiers in Forests and Global Change, 8, Article 1631859. https://doi.org/10.3389/ffgc.2025.1631859
Yoon, S., Liem, N. D., Tu, L. H., Loi, N. K. (2024). A Dataset for Species Distribution Modelling of Mangroves in Vietnam: Based on the National Forest Inventory Monitoring. GEO DATA, 6(3), 150-158. https://doi.org/10.22761/GD.2024.0022